

The year was 2023. I had just started my journey of reading books and making notes from them.
I was following some of the YouTubers who recommended self-improvement books. One of my favorites is a doctor turned YouTuber – Ali Abdal. I stumbled upon his website which talked about his most recommended books and there I found the book called Your Money Your Life (YMYL) the main point of the book that interested me was, how to be financially freedom. So from May 17, 2023, to Jul 21, 2023, I completed reading this book. (I know, I know, I am a slow reader but hey, I had a goal of reading 4 pages a day). I found the book fascinating but I thought I would never have the time and resources to implement the book’s practices until it was mar’24. I could not believe that I thought about implementing what I had learned after 8 months of finishing the book. I overthought how I would implement it. If you are interested in financial freedom but are not sure how to go about it, this blog might provide you with a good starting point. In this blog I am sharing my process of tracking my hard-earned money, seeing its distribution across various categories, and doing monthly trend analysis to understand the trend of investments vs expenditures.
But before I get into the details ( and forgive me if I do not share the exact numbers on rupees for obvious reasons); let me pay a tribute to Your Money Your Life (YMYL) book by giving you a quick summary of it.
Summary of your money and your life-
- Financial awareness: track all income and expenses meticulously to understand your true financial situation.
- Life energy valuation: calculate your real hourly wage by considering all job-related costs and time, helping you see the true cost of your purchases.
- Mindful spending: regularly evaluate your expenses based on fulfillment, alignment with values, and necessity, aiming to reduce unfulfilling expenditures.
- Financial independence: work towards the “crossover point” where investment income equals expenses, freeing you from the need for paid employment.
- Long-term financial management: develop knowledge about safe, income-producing investments to sustain your lifestyle beyond traditional employment.
I realized that I have not published my detailed review of this book yet. I will publish it very soon.
The first step of financial freedom comes from financial awareness (the first bullet point) where it is expected that you should track your income and expenses meticulously to understand your true financial situation. Drum rolls please, as I now bring out the star of my blog, the financial tracking page – I call it the “$ tracking” page and my 5-step process for Financial Transformation.
Step 1 – The “$ tracking” page
Ok, unless you have been living inside a cave, you might well be aware that I use Notion (notion.co) as my life planning and tracking tool. Why? – that is another blog (which is overdue) but for now, just go with it that I do and it is awesome!!! It has brought a lot of clarity to my life. To improve, we must know where we are and Notion helps me capture all the right metrics. Ok enough of notion praise, let’s get back to my $ tracking page.
Step 2 – objectives of $ tracking
I am putting this effort to achieve below objectives –
- To make my unconscious spending behavior, conscious which will help me make necessary course corrections in my behavior.
- I want to have at least 6 months of salary saved in my accounts which can act as a rainy-day fund or vacation fund depending on life’s situation
- I want to focus consciously on investing at least 40% of my yearly money (in funds, bonds, etc.) which would earn me returns in 5 to 10 years (income-producing investments to sustain a lifestyle beyond traditional employment.)
Step 3 – the boring bit –
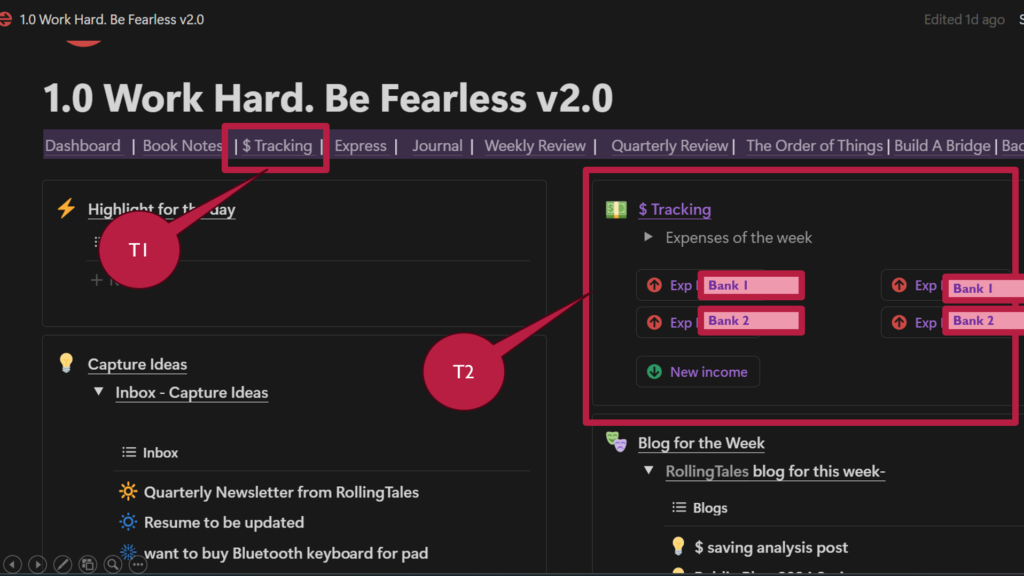
This is my home page in notion, where I track my life’s activities. On the header, there is a menu bar that links to various sub-pages whereas the dashboard hosts a summary of the various pages and key inputs to it.
- T1 – shows a link to a detailed view of the $ value tracking page
- T2 – is a quick entry to log the expenditures in Bank 1, Bank 2 Debit and Credit cards or income. The red icon color denotes expenditure and Green, no prize for guessing here, is for Income. This way, I have an easy way to log the data, rather than going into the detail page.
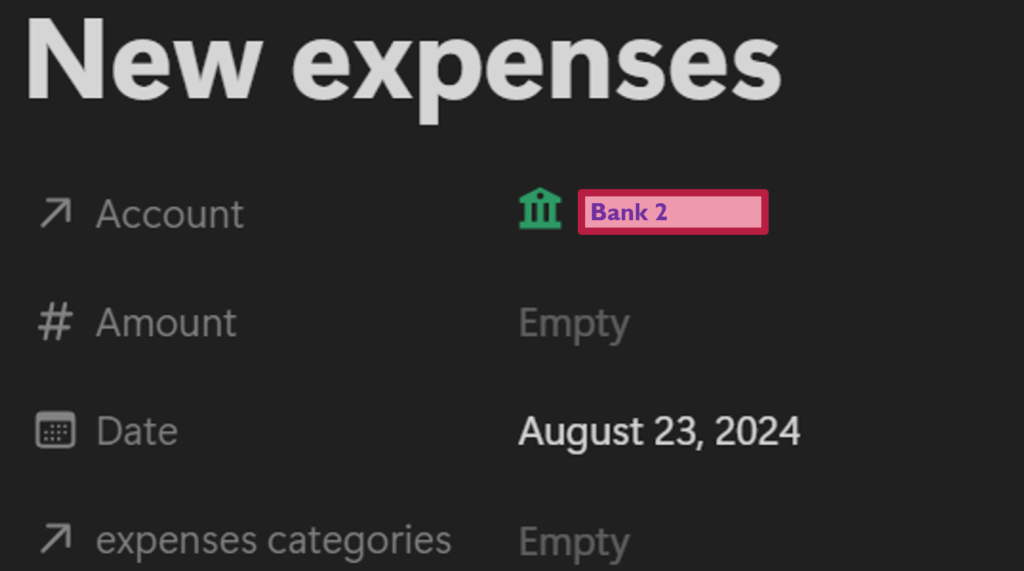
Once I click on the T2 buttons, I will see the above view where I can log the date, expense amount, and category of the expense. I will showcase all the categories of my expenses. I created 4 buttons for 2 banks’ debit and credit entries so I don’t have to select the account each time but from the account drop-down, I can select the account where the expenditure needs to be logged. A similar view is available for the Income button as well. All the information captured in this form would flow into a database, which we slice and dice during the analysis. This helps in capturing the information fast and quickly which makes tracking the $ expenditure easy.
Inside the $ Tracking Page –
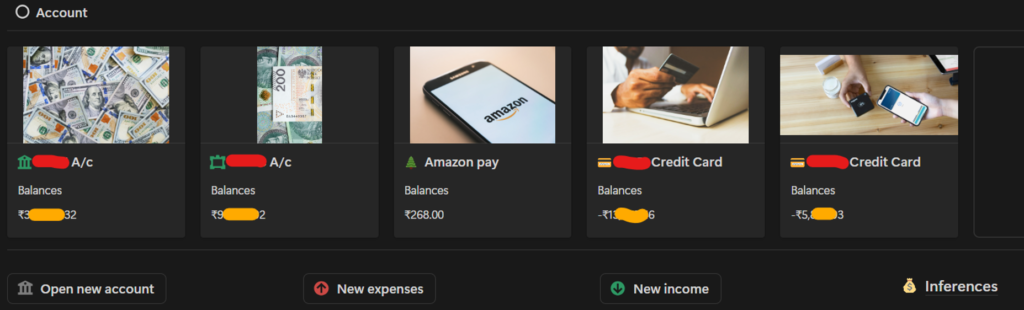
If you click on T1 in the first screenshot, we come to the above view, where we have another way to input the data into the backend database. Balance of each of the accounts ( debit shown in green and Credit card would be marked with –ve). This is calculated based on account balance – Expenditure + Income. Astute readers would have noticed the Inference link – this is for documenting the inference of the analysis that I perform, month on month. We will get into that in due course.
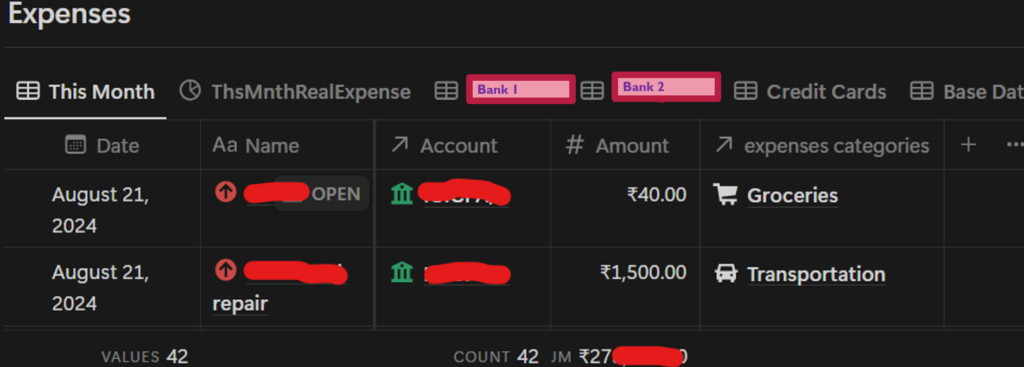
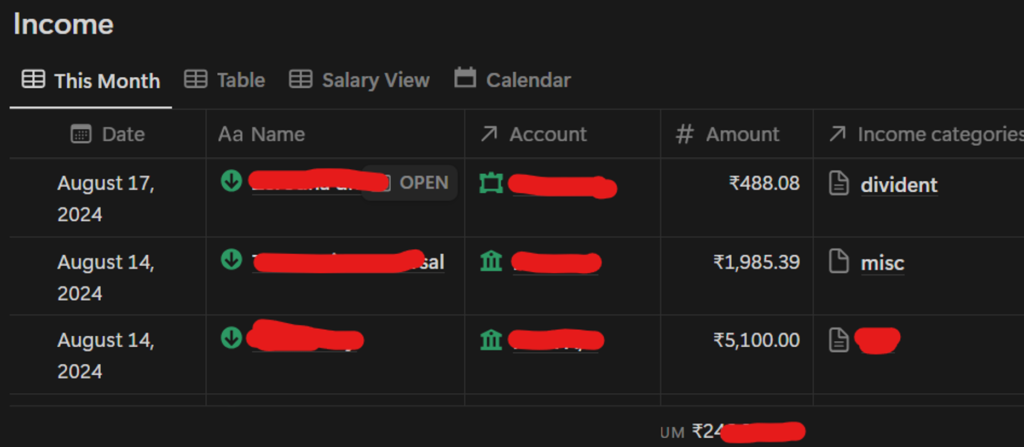
Here is a view of the expense database. All entries get collected over here. You can see that 42 entries have been logged for August 24. This database can be viewed on various accounts i.e. Bank 1, Bank 2, or credit card expenses, so I review that expenditure.
Similarly, the other screenshot explains the various income sources that get accrued in the Income database.
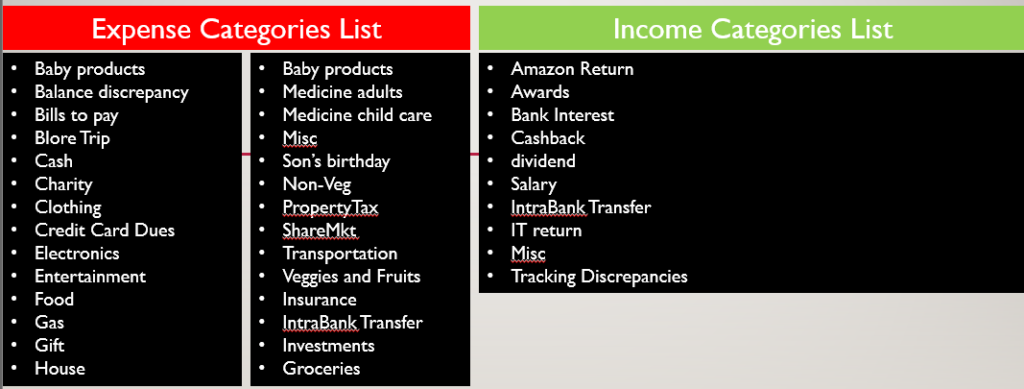
Here is the list of expense categories and Income categories that are configured based on my experience –
Step 4 – monthly analysis
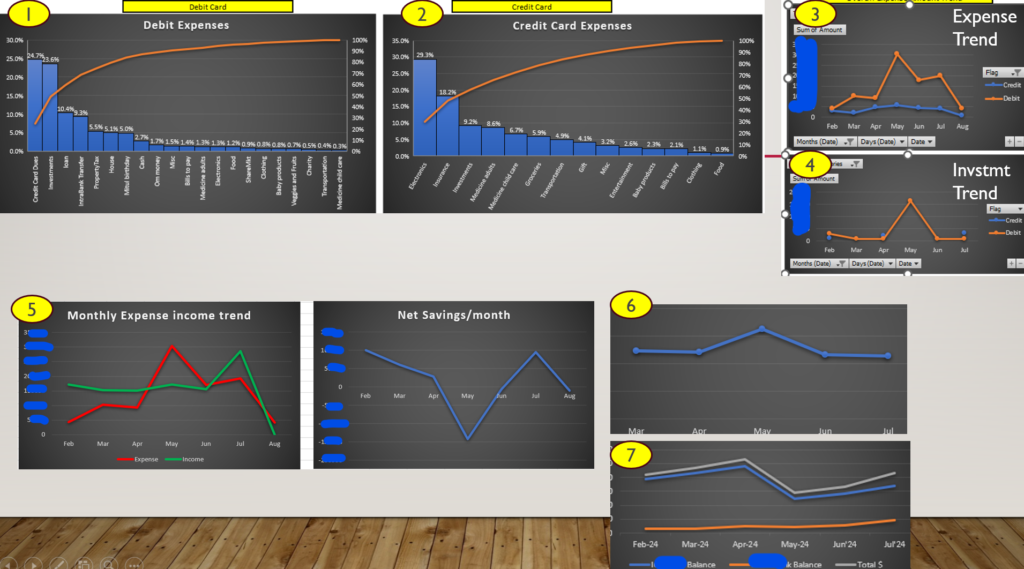
I do the financial analysis every month. I download all the information from the database in Excel format. I have various pivots already applied to the table which helps me put the information in a graphical view.
In this analysis, I am trying to answer below questions:
- Which categories are contributing the highest in debit expenditure?
- Which categories are contributing the highest in credit card expenditure?
- How are my credit card and debit expenses trending month on month?
- How is the investment and Insurance trend?
- How is my month-of-month income trend vs expense trend?
- What is the salary trend?
- How is my total savings in both accounts?
Step 5 – inferences and actions
Looking at this graphical representation of my expenditure, I draw meaningful insights. The below sample inferences are documented to illustrate the point –
- I have been spending 25% of my money on credit card dues.
- Out of all the credit card expenses I have incurred, almost 30% have been spent on electronic devices. I bought a Pixel watch 2, an impulse buy, and 2 phones for my family. One for my mother and one for my wife, which I would consider essential spending as their phones were unusable. However, this view helped me understand that I should make more prudent choices with buying electronic devices. I have decided to curb my enthusiasm while surfing on the amazon. I have decided to add one device per 6 months. For example, I have been wanting a Bluetooth keyboard for my Xiaomi pad but I have decided to plan it on Jan’25 and not before that. This clarity helps me to be excited about that purchase rather than feel guilty about it.
- Partially my salary is dipping in the graph but once I analyzed it, I understood that it was due to the insurance and NPS cut directly from the salary.
- In May and Jun, my expenses were way higher than my monthly income. That was due to my son’s first birthday celebration, all the property tax deadlines, and society’s maintenance costs. From now on, I will ensure that I plan better in the next year to have savings in Mar and Apr. Each year this must be happening, since I am not logging my experiences, I was not learning from them.
- I have analyzed that even though the “bills to pay” category caters to 1.4% of the overall expenditure, I can surely reduce it by closing my join number. And I did. I felt happy with that decision.
- Another informed decision was about transportation. Here I log all my petrol costs. I realized that I am spending 3k per month on my car’s petrol. This can be reduced if I use a two-wheeler for my nearby needs. I did and I see I have used the 3k worth of car petrol for 2 months now.
Conclusion-
First of all, reading a book and learning from it, never goes to waste. Now I have a clear picture of my finances and I have a view of where I want to be.
What do you think about this $ tracking? Would you like to give it a try? Don’t hesitate if you think I can be of any assistance in helping you set up your $ tracking page, send me an email and we will talk.